February 2018
The FA periodically publishes demographic data about our membership, such as in the FYI page of our November 2017 issue.
The more detailed breakdown below is based on fall 2017 data and illustrates how full-time faculty are distributed among our three campuses.
General Overview
Total full-time faculty |
Faculty by major category |
||||
| Teaching | 301 | Classroom faculty | 301 | ||
| Non-teaching | 177 | Library services | 15 | ||
| total | 478 | Coordinators | 5 | ||
| Counselors | 42 | ||||
| Professional assistants | 68 | ||||
| Specialists | 47 | ||||
Ratio of day-time sections to full-time faculty* |
|||||
| Ammerman | 7.4 | ||||
| Grant | 7.6 | ||||
| Eastern | 6.4 | ||||
* Higher values reflect a greater number of courses taught as overload or by adjunct faculty. |
|||||
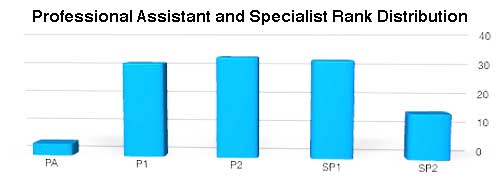
Rank Distribution: Professional Assistants and Specialists
Total professional assistants at college |
by function* |
||||
| PA | 4 | ||||
| PA1 | 31 | ||||
| PA2 | 33 | ||||
| total | 68 | ||||
Professional assistants by campus |
|||||
| count | percent | ||||
| Ammerman | 27 | 40% | |||
| Grant | 18 | 26% | |||
| Central | 17 | 25% | |||
| Eastern | 6 | 9% | |||
Total specialists at college |
|||||
| SP1 | 32 | ||||
| SP2 | 15 | ||||
| total | 47 | ||||
Specialists by campus |
|||||
| count | percent | ||||
| Ammerman | 11 | 23% | |||
| Grant | 10 | 21% | |||
| Central | 23 | 49% | |||
| Eastern | 3 | 6% | |||
 |
|||||
Rank Distribution: Classroom Faculty
Teaching faculty by campus |
Teaching faculty by rank |
|||||
| Ammerman | 161 | Instructor | 22 | |||
| Grant | 90 | Assistant professor | 69 | |||
| Eastern | 50 | Associate professor | 100 | |||
| Professor | 110 | |||||
 |
||||||
Rank Distribution: Student Services, Librarians, and Coordinators
Since writing and math center coordinators have teaching responsibilities as part of their regular duties, those faculty are included in the classroom faculty data.
| Student services by campus |  |
||||
| Ammerman | 18 | ||||
| Grant | 15 | ||||
| Eastern | 7 | ||||
| Central | 1 | ||||
| Counseling by campus | |||||
| Ammerman | 8 | ||||
| Grant | 9 | ||||
| Eastern | 3 | ||||
 |
|||||

